Rats Will Eat Anything
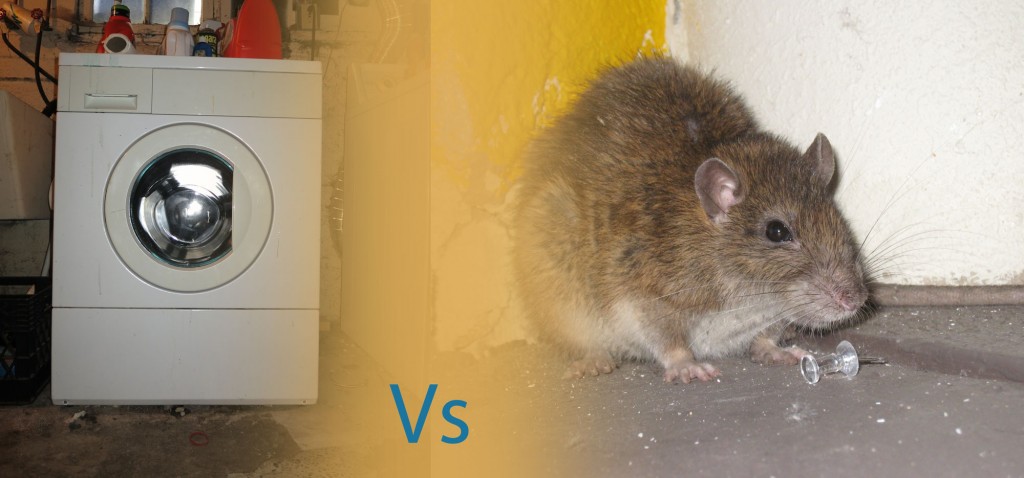
A few years ago I made the mistake of storing food in my basement in a way that was less than safe from rodents. A small population boom in rats occurred before we understood what was happening. When we removed all access to the food in the dead of winter, we introduced a starvation whose panic we later read in the gnawed plastics on everything enclosing nourishment.

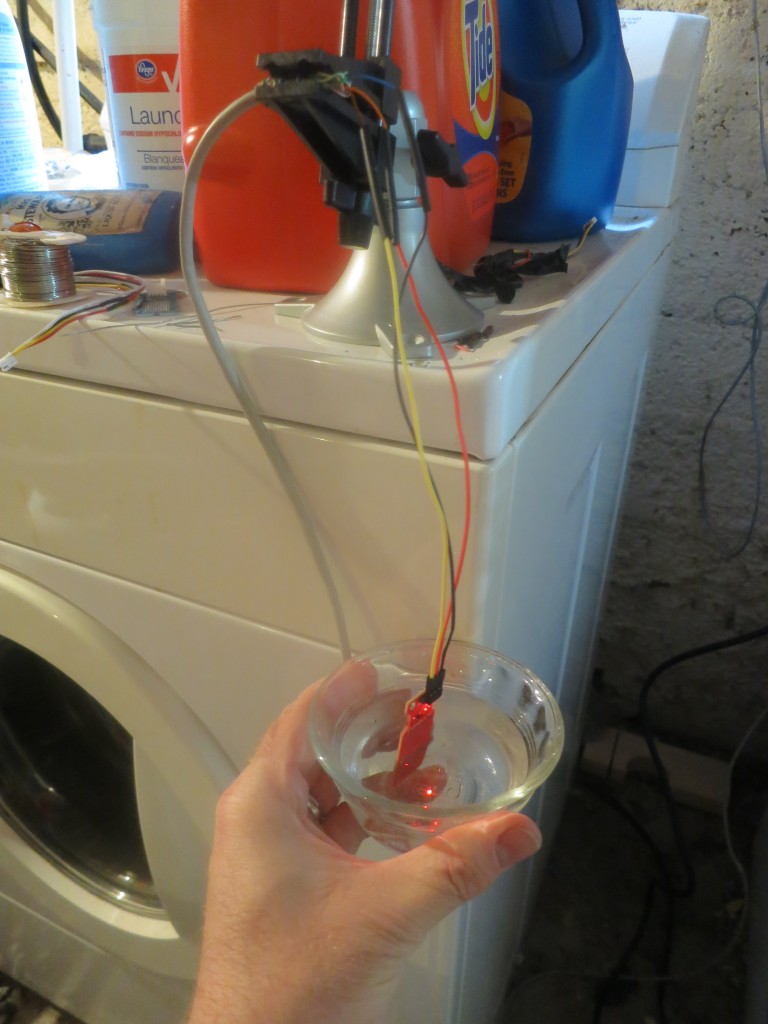
All of this was bad. Rat poop and pee are nasty. But the worst thing was the desperate rats eating the rubber tubing and gaskets inside our washing machine. One frosty morning I came down to find soapy cold water hemorrhaging out of the washing machine and covering the floor of our basement. I suddenly understood why someone would want a flood monitor.
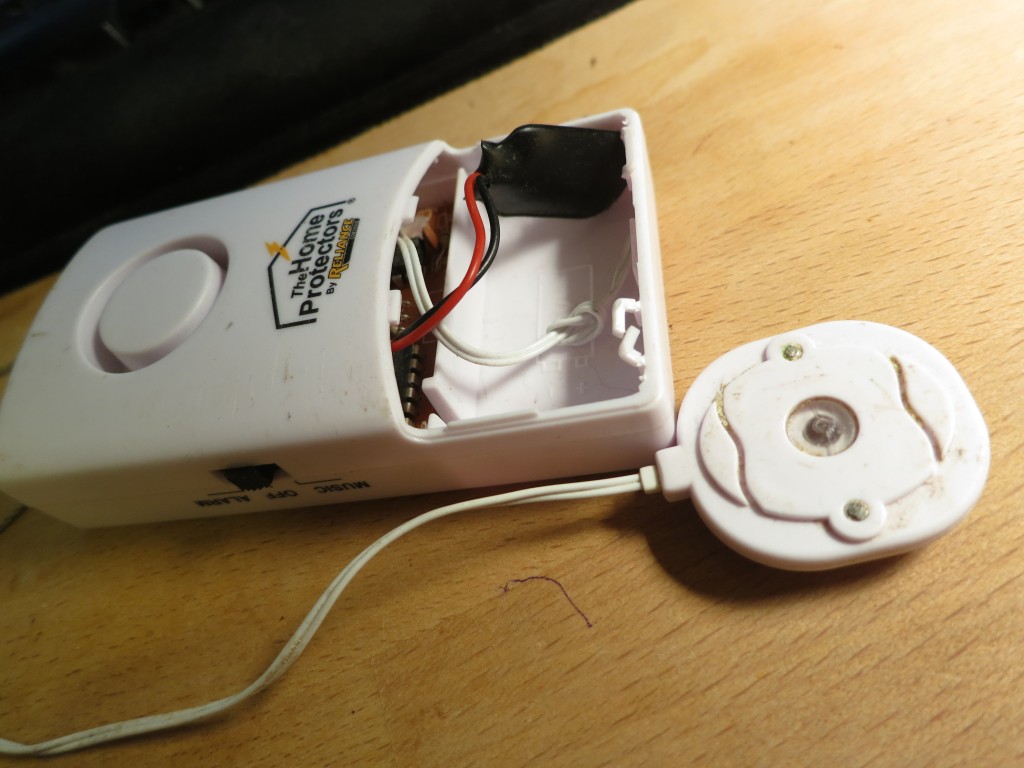
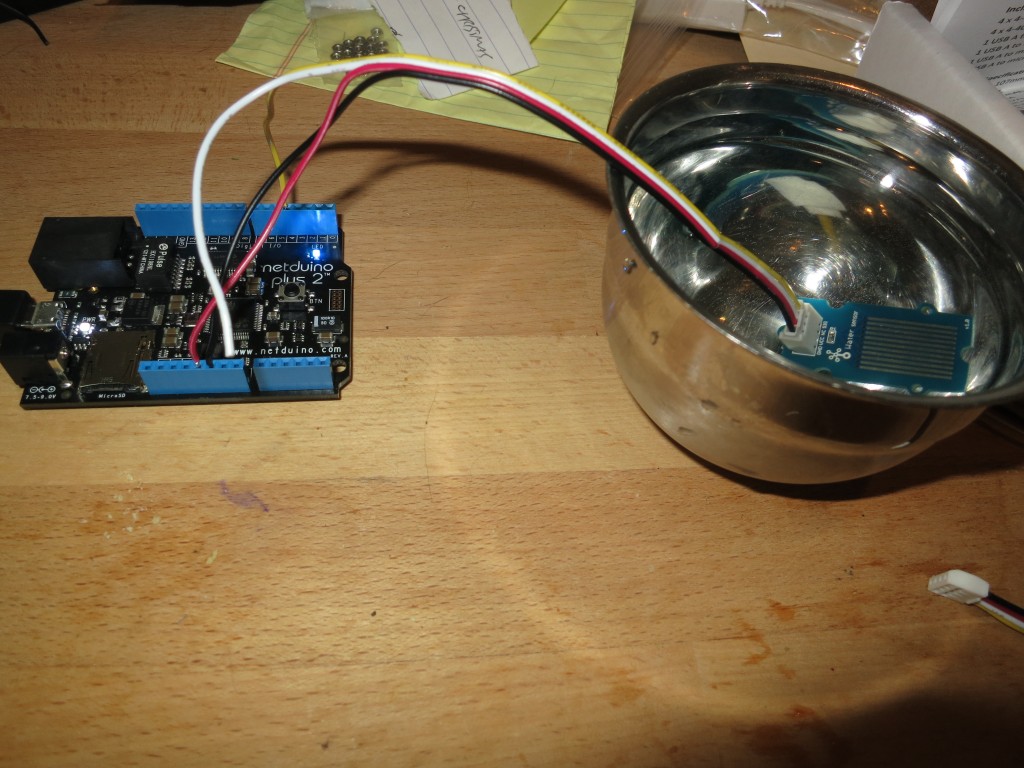
I started out with a nine-volt battery powered deal with an audible alarm.

This is better than nothing, but it wasn’t going to be able to tell me about problems when I was out of town, or, for that matter, when I was at work. I wanted more. Specifically, I wanted it to plug into Nagios, which started out monitoring a few hard drives for me but has grown over the years into something a mid-sized business with its shit together might be using to monitor their network. Nagios had become the way I kept track of problems in the house. It already paged and emailed me, and it would keep metrics and historical data.
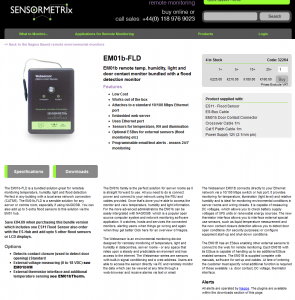
The first thing I did was look for a commercial product that did this — surely someone else needed the same thing. And, indeed, it has been done:

As I type, that’s about $425 US, which still seems ridiculous to me, no matter how industrial and bullet proof the device surely is. I found another company doing this as well, but they charged a similar if not higher price for the same functionality.
Couldn’t I do all this with an Arduino? And the Internets of Stuff?
Why Netduino
I looked at Arduino, but a less popular alternative appealed to me: Netduino.
* I already use .NET for work. I don’t love Microsoft, but I’ve always had to admit that C# is a truly excellent environment.
* Threads, events, timers
And, probably best of all:
* In circuit debugging
I’ve done enough near-embedded programming to appreciate being able to step through code in a debugger or hit pause. I was willing to pay a bit more for this, and to tolerate some compromises in the environment to avoid Resharper withdrawl.
It also meant a lot to me that, although the board was $60 instead of ~$30 for an Arduino, it came with Ethernet built in and I wouldn’t have to futz around with a shield on day one. This looked like a kinder, gentler introduction to Arduino-esque work.
Porting NRPE to C# and the Micro Framework
As pleasant as C# usually is, it takes working in a smaller version of it to remind you how much is in the libraries, and not in the language proper. Working on the Micro framework is like working in a galley kitchen on a tiny sailboat when you are used to a decent home kitchen. Templates? Nope. String formatting? Nope. Linq? Hah – that’s rich.
Fortunately, NRPE is a very simple format:
[2 Byte int16_t] – Version number
[2 Byte int16_t] – Type (Query/Response)
[4 Byte u_int32_t] – CRC32 Checksum
[2 Byte int16_t] – result code (OK, WARNING, ERROR, UNKNOWN)
[1024 Byte char] Buffer
Even so, I struggled with byte ordering and padding for a bit of time before figuring it out. The biggest problem was getting a compatible CRC working, and finally I ended up porting this code to C#. There was other code out there that might have worked, but nearly all other C# code makes good, healthy, virile use of templates and Linq and everything else you can’t have in 192kb of memory.
How Does It Work
You can have a look at the code yourself, but those without a Nagios installation might like a preview of how things work once you’ve installed things.
Here’s how to call the various checks manually. Here we are running check_nrpe (the client to our Netduino server) from Ubuntu:
# ./check_nrpe -n -H noah.doodle.local -c check_temp

OK - Temperature = 25.6C 78.1F Relative Humidity = 33.6% | temp_celsius=25.6000004;35;38;0;100, relative_humidity=33.6000023%;70;80;0;100, temp_fahrenheit=78.080000686645519;95;100.40000000000001;32;212
# ./check_nrpe -n -H noah.doodle.local -c check_flood

OK - No water detected | water_detected=0
# ./check_nrpe -n -H noah.doodle.local -c check_uptime

OK - Uptime: 03:42:51.2740000 Free memory: 101364 | uptime_in_seconds=13371, uptime_in_hours=3, uptime_in_minutes=222, free_memory=101364
These are the three services I’ve written so far. There are three main parts visible here:
The result code. In this case the service is considered to be in a good condition.
- Temperature = 25.6C 78.1F Relative Humidity = 33.6%
This is human-readable status text that will appear in Nagios.
- temp_celsius=25.6000004;35;38;0;100, relative_humidity=33.6000023%;70;80;0;100, temp_fahrenheit=78.080000686645519;95;100.40000000000001;32;212 :
The values after the pipe is performance data which is all logged, and can be retrospectively graphed using various plug-ins.
So here’s how the service appears in Nagios. Here apparently the rats are back and have found their way past the metal plates I bolted onto the bottom of the washing machine, or perhaps our first floor toilet has overflowed and poured down a heating duct into the basement again (no rats to blame for that, unless my butt can be considered to be a sinking ship.) And something has gone wrong with the temperature sensor – maybe the leads have been eaten by the rats.

Here’s what the command line output would look for these two problem cases:
WARNING - Could not read temperature. |
CRITICAL - Water detected! | water_detected=1
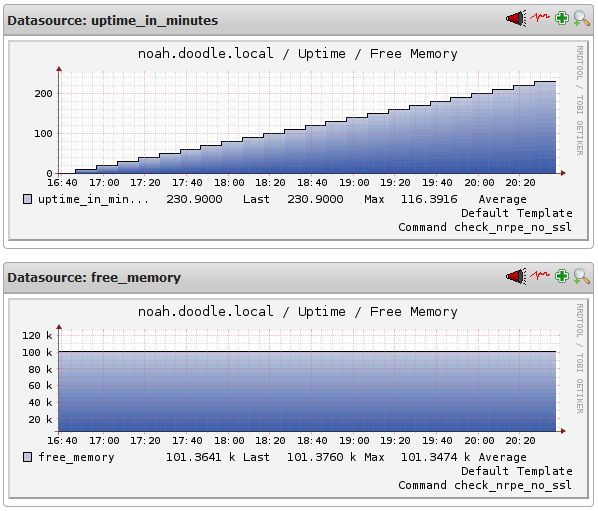
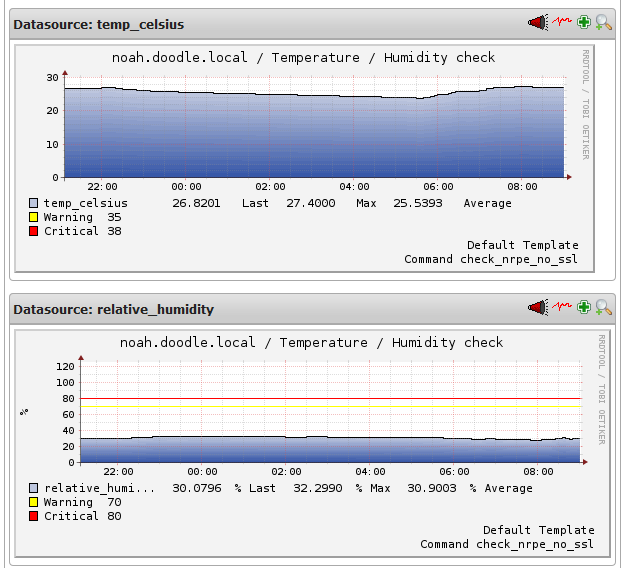
Here’s a screenshot of what can be done with the performance data collected over time, from a time without emergencies or failures. We can see a steadily rising uptime, and a constant memory usage (no leaks apparently):

Some variation in the temperature, and a nearly constant humidity:

Limitations
It’s important to note that the -n here is *essential*:
./check_nrpe -n -H noah.doodle.local -c check_uptime
This disables SSL for NRPE. There’s apparently no room in the Netduino for such a large library. If this is essential to you I suppose you could wrap it inside a VPN tunnel, etc.
Here’s what you’ll see if you try to call NRPE without SSL:
# ./check_nrpe -H noah.doodle.local -c check_flood
CHECK_NRPE: Socket timeout after 10 seconds.
There’s also some sanity checking in the code; if the Query Type is not recognized TinyNrpeServer will not be able to respond to the query and will not try. A debug message will give a hint about SSL if you are attached to the console.
Stability
If you look through the code, you may find it quite paranoid about errors and crashes, with two separate hard reboots in the code. This is because I tested the code fairly hard and I was striving to prevent the device from ever becoming unresponsive and needing a reboot.
The device now does a hard restart in two cases:
1) When it gets an exception
There are some exceptions I discovered that occur normally, such as socket disconnection errors, which can often be recovered from without resorting to rebooting the device. Unfortunately, not ALL of them seemed to be recoverable, or at least not consistently, and rather than distinguish, I chose to restart the device. Under normal operating conditions they are quite rare.
2) When it hasn’t received a query for a configurable time interval
In testing, I tested using very abusive conditions, but these conditions could easily get the Netduino into a state where not only would my code not hear incoming network connections (which could arguably perhaps be my fault), the device’s network stack would crash, and it would become unresponsive to ping, which I felt a whole lot less responsible for.
In my code I have this timeout configured like this:
/// <summary>
/// Number of milliseconds before the board will reboot itself.
/// </summary>
public const int InactivityTimeout = 60 * UpTimeCheck.SecondsPerMinute * UpTimeCheck.MillisecondsPerSecond;
In other words, if it hasn’t had an incoming message in an hour, it’ll reboot itself. If you need to fine-tune this interval, I would set this to at least twice your minimum check interval. So if you check the device every 5 minutes, set this to at least 10 minutes.
I chose to set this much higher so I can see via the uptime graph if this ever actually happens — a hour of downtime should be unambiguously visible.
In all fairness to the Netduino platform, I seriously doubt anyone will hang this server under a typical network load. A discrete poll from a single Nagios server every minute or two is not going to seriously tax anything. Perhaps once in a blue-moon a network exception will occur and the device will quietly reboot — if it does, you should see that reflected in the uptime performance data, but still enjoy essentially uninterrupted availability. I don’t expect anyone to actually make the device unresponsive, and activate the watchdog reset. But please tell me how it goes for you.
If I were to take this any farther, I would want a proper watchdog timer in hardware.
Expansion
I didn’t really NEED anything more than a flood monitor, but I thought I’d throw in at least one other metric to get the code ready to handle multiple checks, hence the temperature check.
Here’s the least you’d need to do to implement a check:
/// <summary>
 /// An example of the least you need to do to implement a check
 /// </summary>
 public class DemoCheck : NrpeCheck
 {
     public override NrpeMessage.NrpeResultState GetStatus(out string statusString, out Hashtable performanceData)
     {
        performanceData = new Hashtable();var demoMetric = 20;
        performanceData.Add("demo_metric", demoMetric);
        statusString = "Demo Metric: " + demoMetric.ToString();
        // Always Ok.
        return NrpeMessage.NrpeResultState.Ok;
     }
 }
You’d probably want some conditional code for the ResultState, and any metrics you have would probably vary. But adding any sort of monitoring should be easy, at least from TinyNrpeServer’s standpoint.
If you come up a sensor you’d like to add, send me an email with a patch or a pull request. I’d love this NRPE server have more monitoring to offer out-of-the-box.
Cost
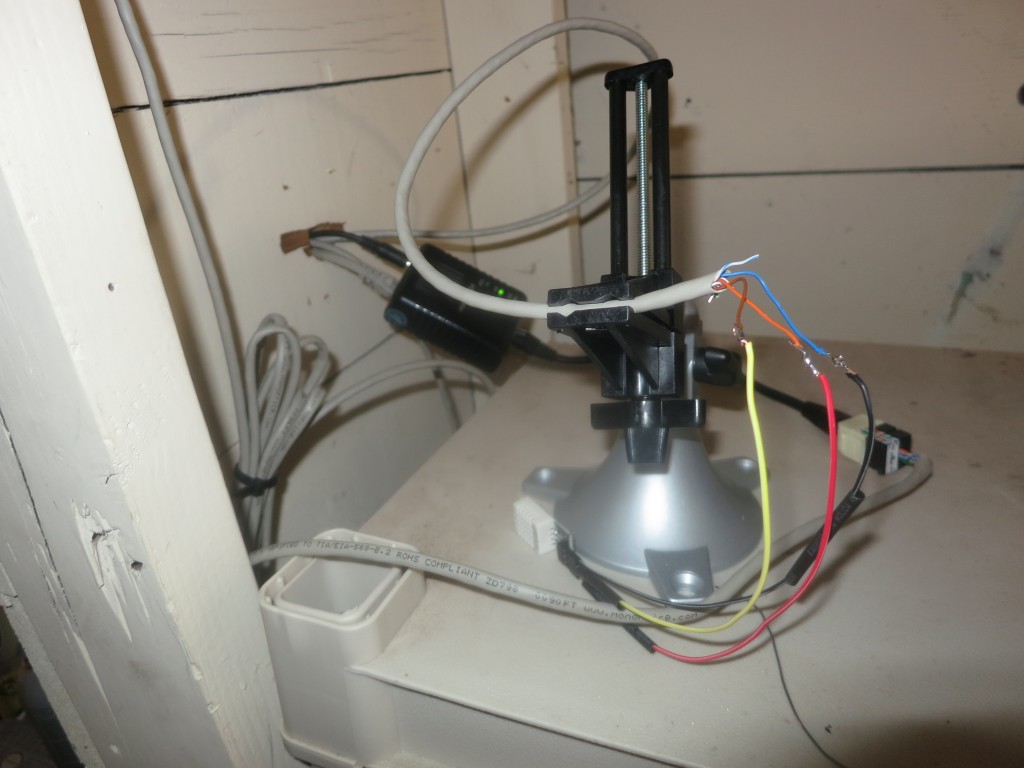
So, if not $425, what did I spend? Probably less than $120. It would have been a lot cheaper if I knew what I was doing — this was my first Arduino-type project and the very basics were mysterious to me. I ended up trying a bunch of things that did not work before finding things that worked passably well.
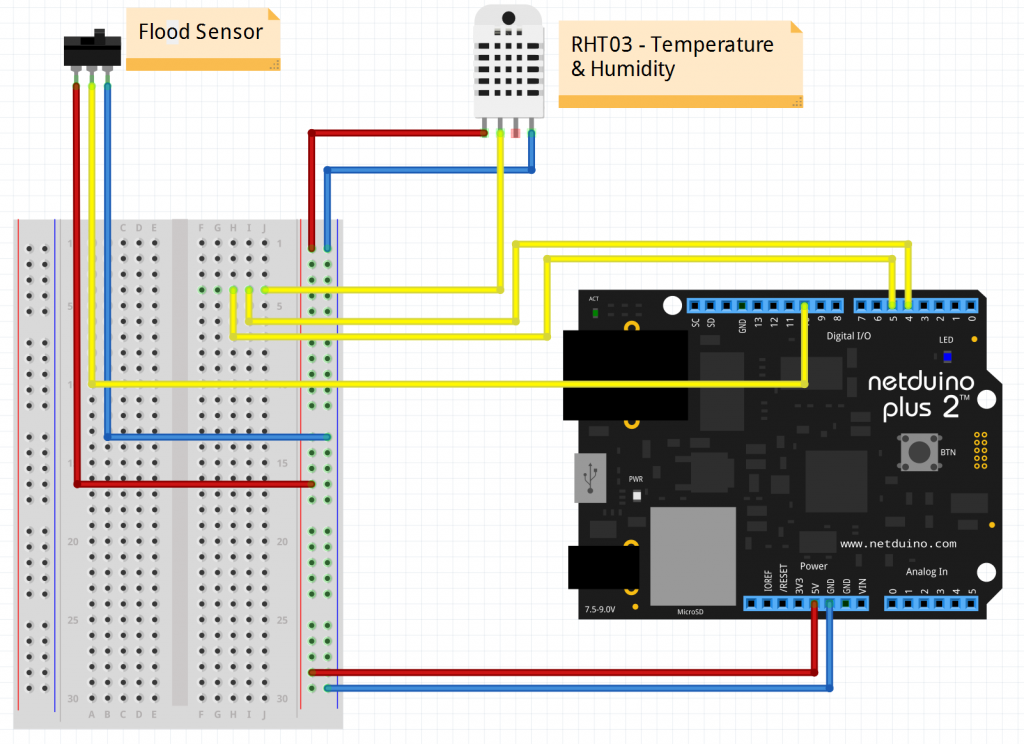
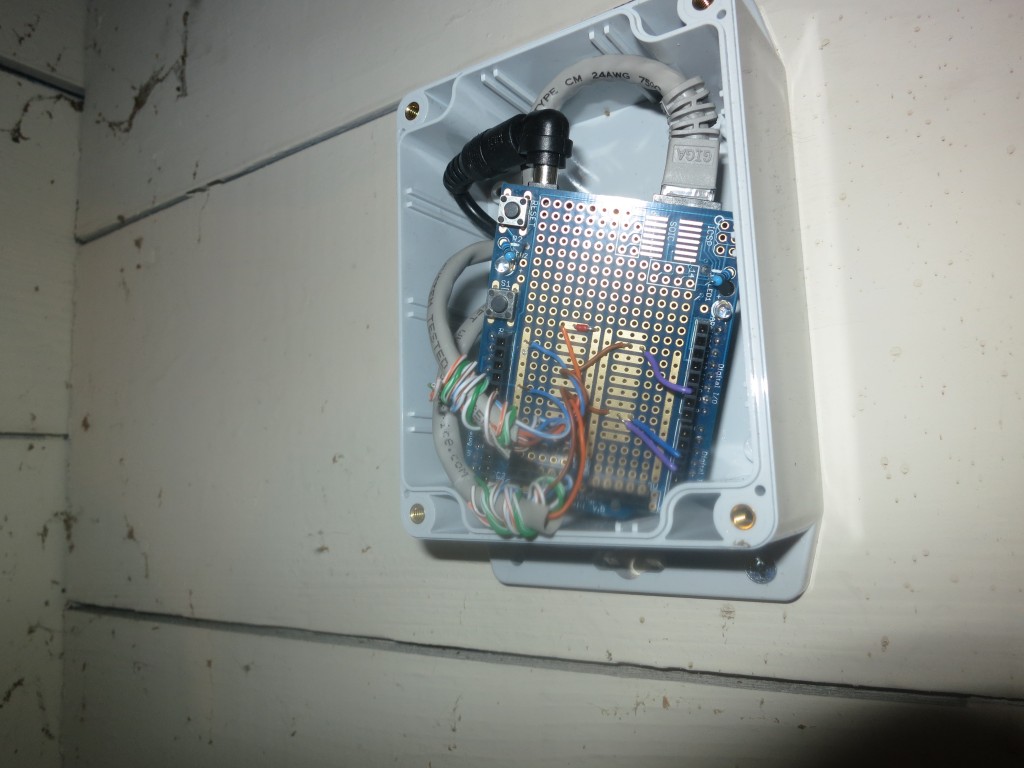
Circuit

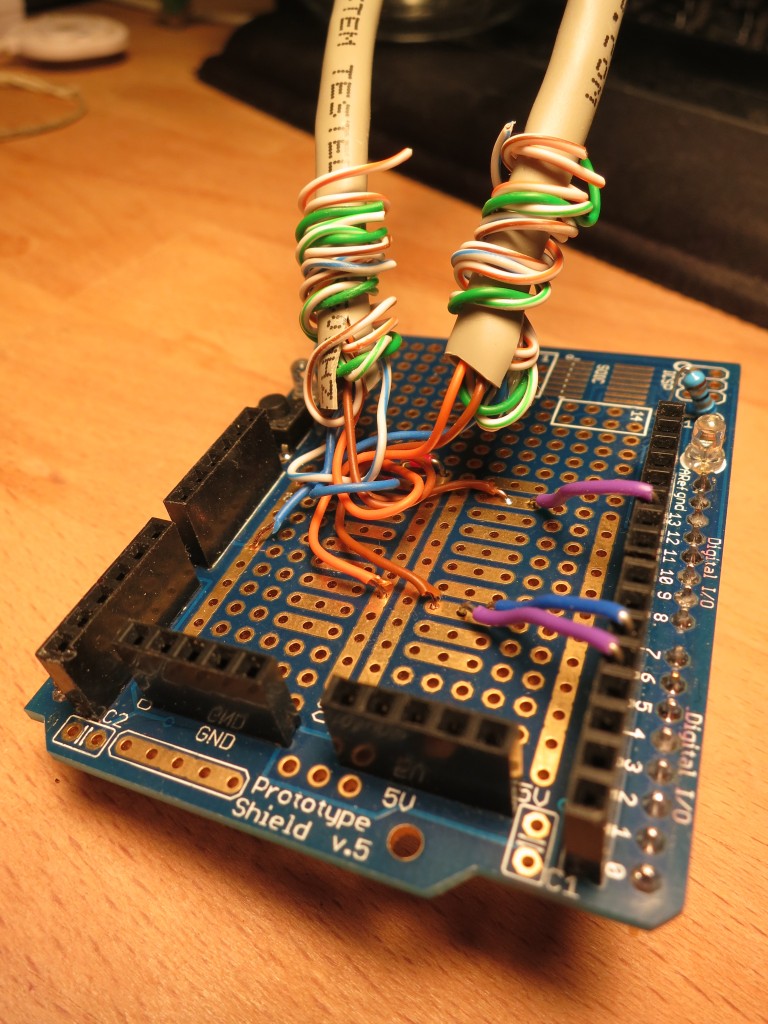
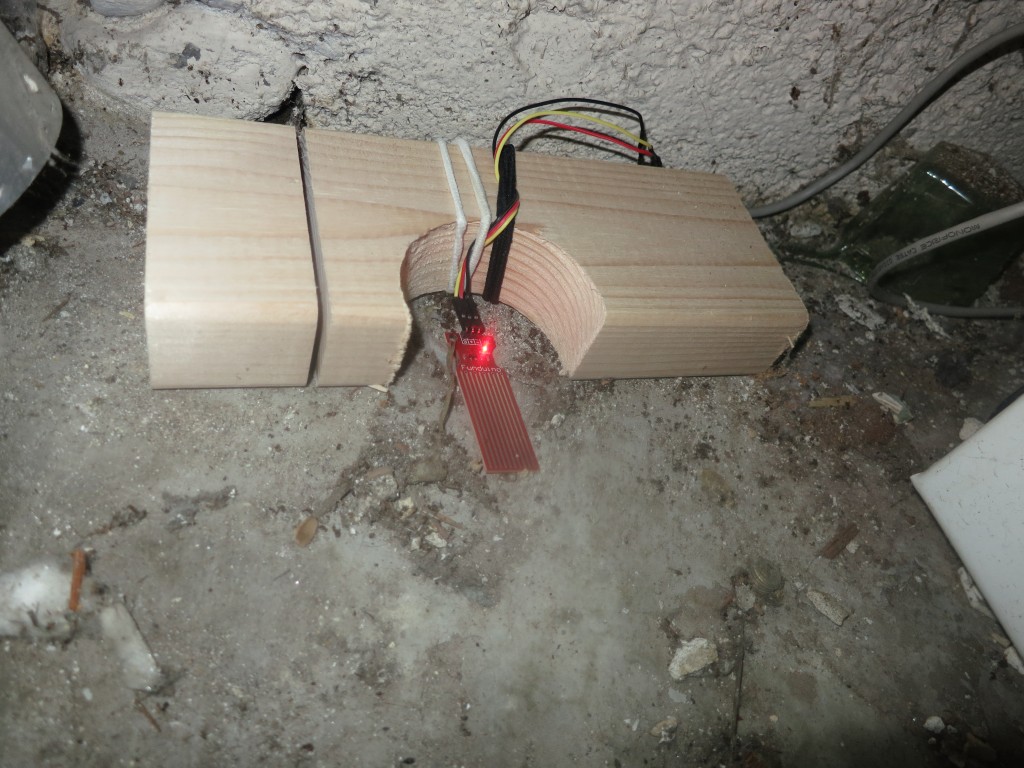
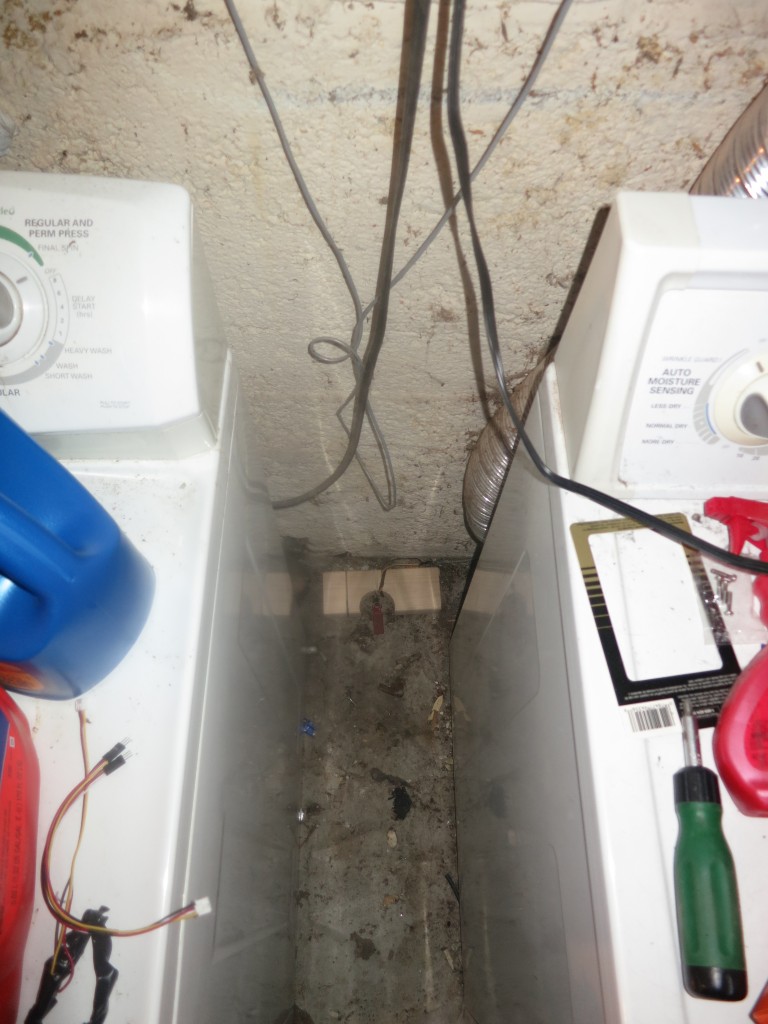
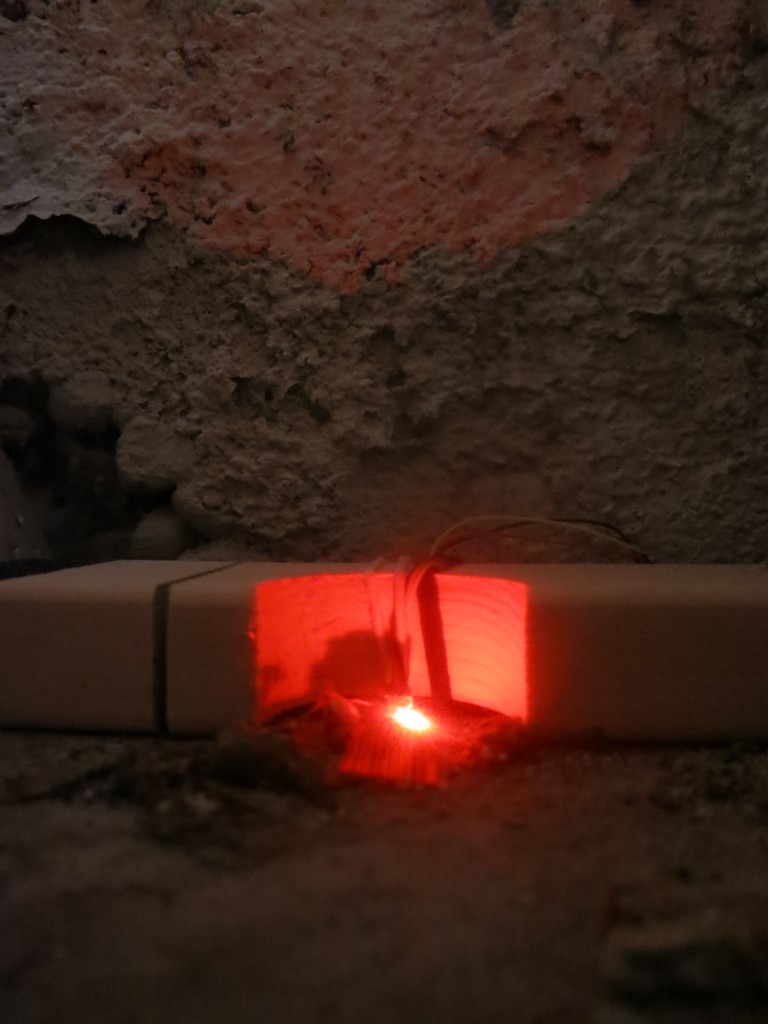
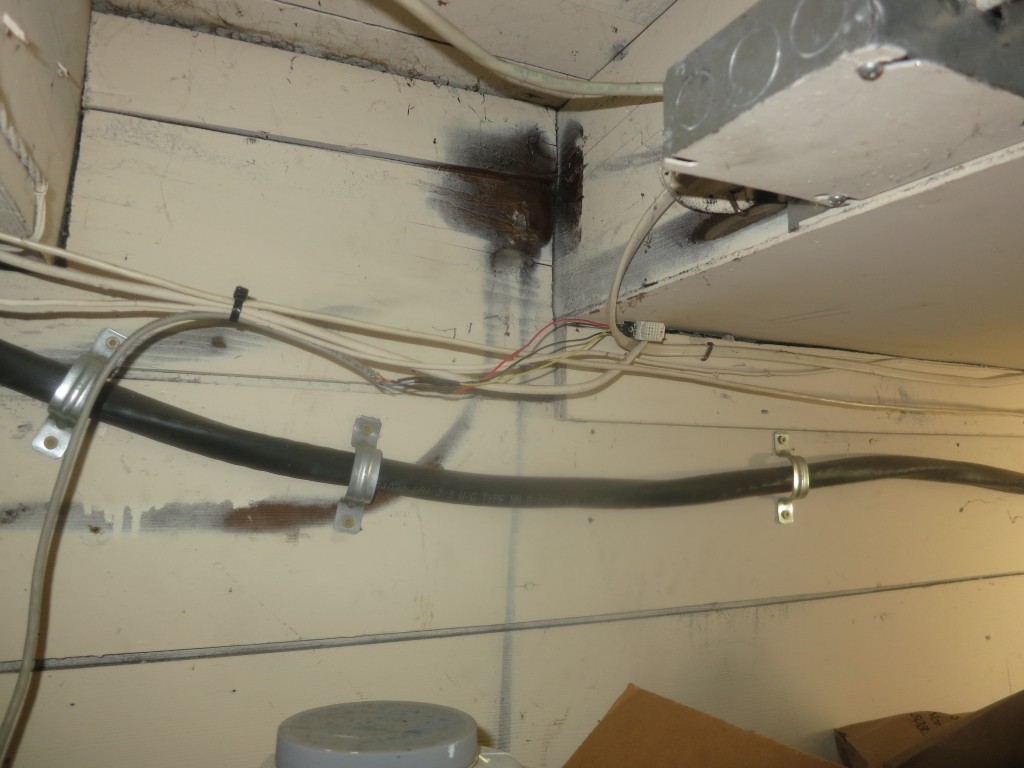
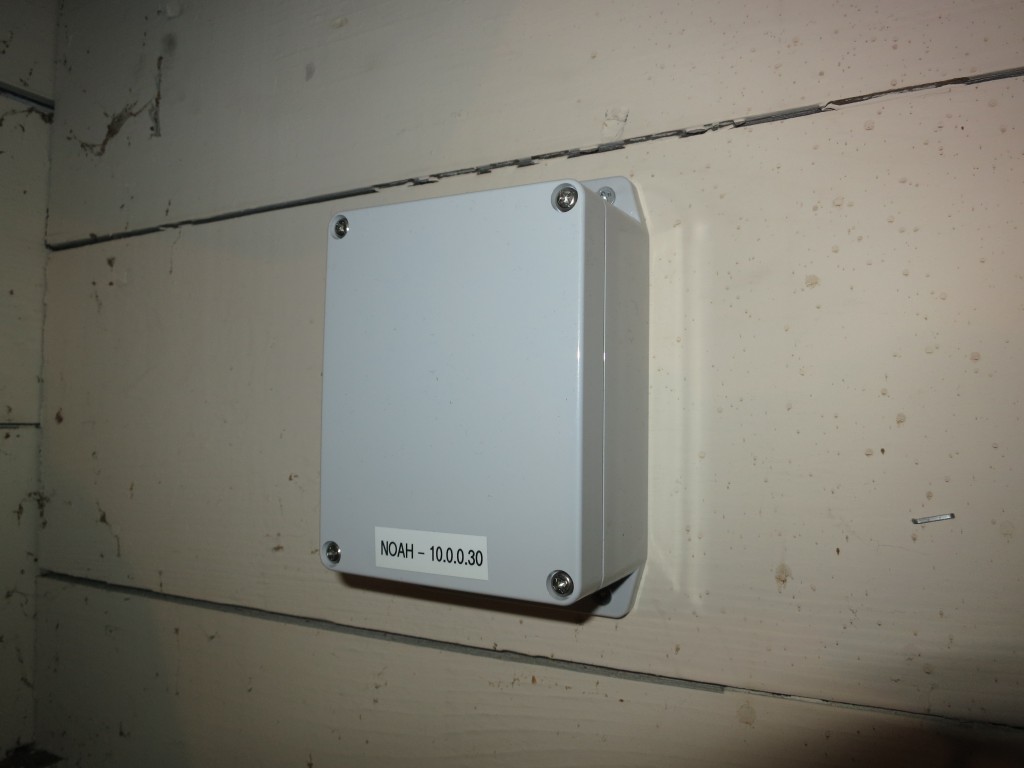
Installation


Bibliography & Appreciation
For invaluable, indirect assistance with the core NRPE protocol, thanks especially to Andreas Marschke and Sadris. For the DhtSensor class, Stanislav “CW” Simicek and everyone on this thread. For cluing me in about Watchdogs and hard reboots, the people on these threads. Chris Walker for the Stopwatch class (and everything else in Netduino, of course).
The Code
https://github.com/StewLG/NetduinoNrpe
